AWR Module overview of ATROPOSS!
Figure 1: open the pop down list to read an abstract what kind of files can be uploaded at once to the parser
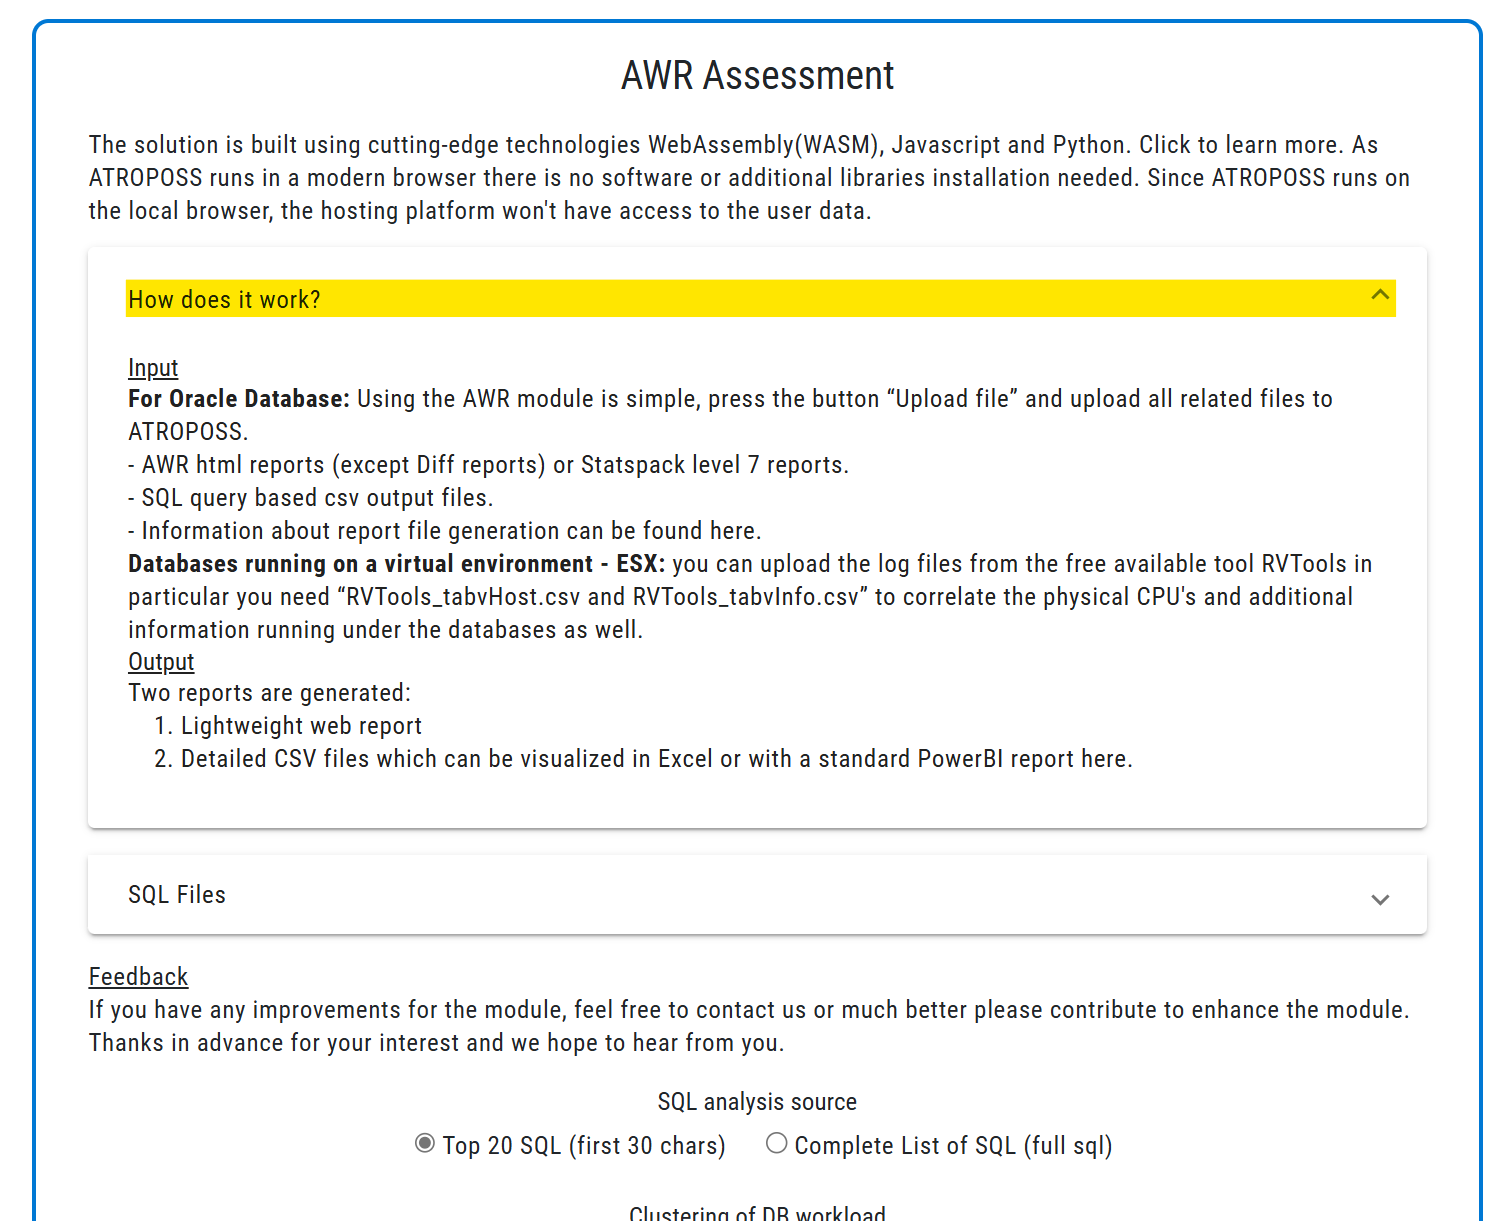
Figure 2: The second pop down list shows what kind of scripts can be downloaded to enrich the discovery / sizing of the oracle databases. Furthermore can scripts busiest_awr.sql and busiest_statspack.sql be downloaded to identified the peak workload time periods, if these are not known.
The script dbSizeCsv.sql can be used for Oracle2Postgresql sizing and the dbspace.sql script for Oracle2Oracle IaaS or PaaS sizing.
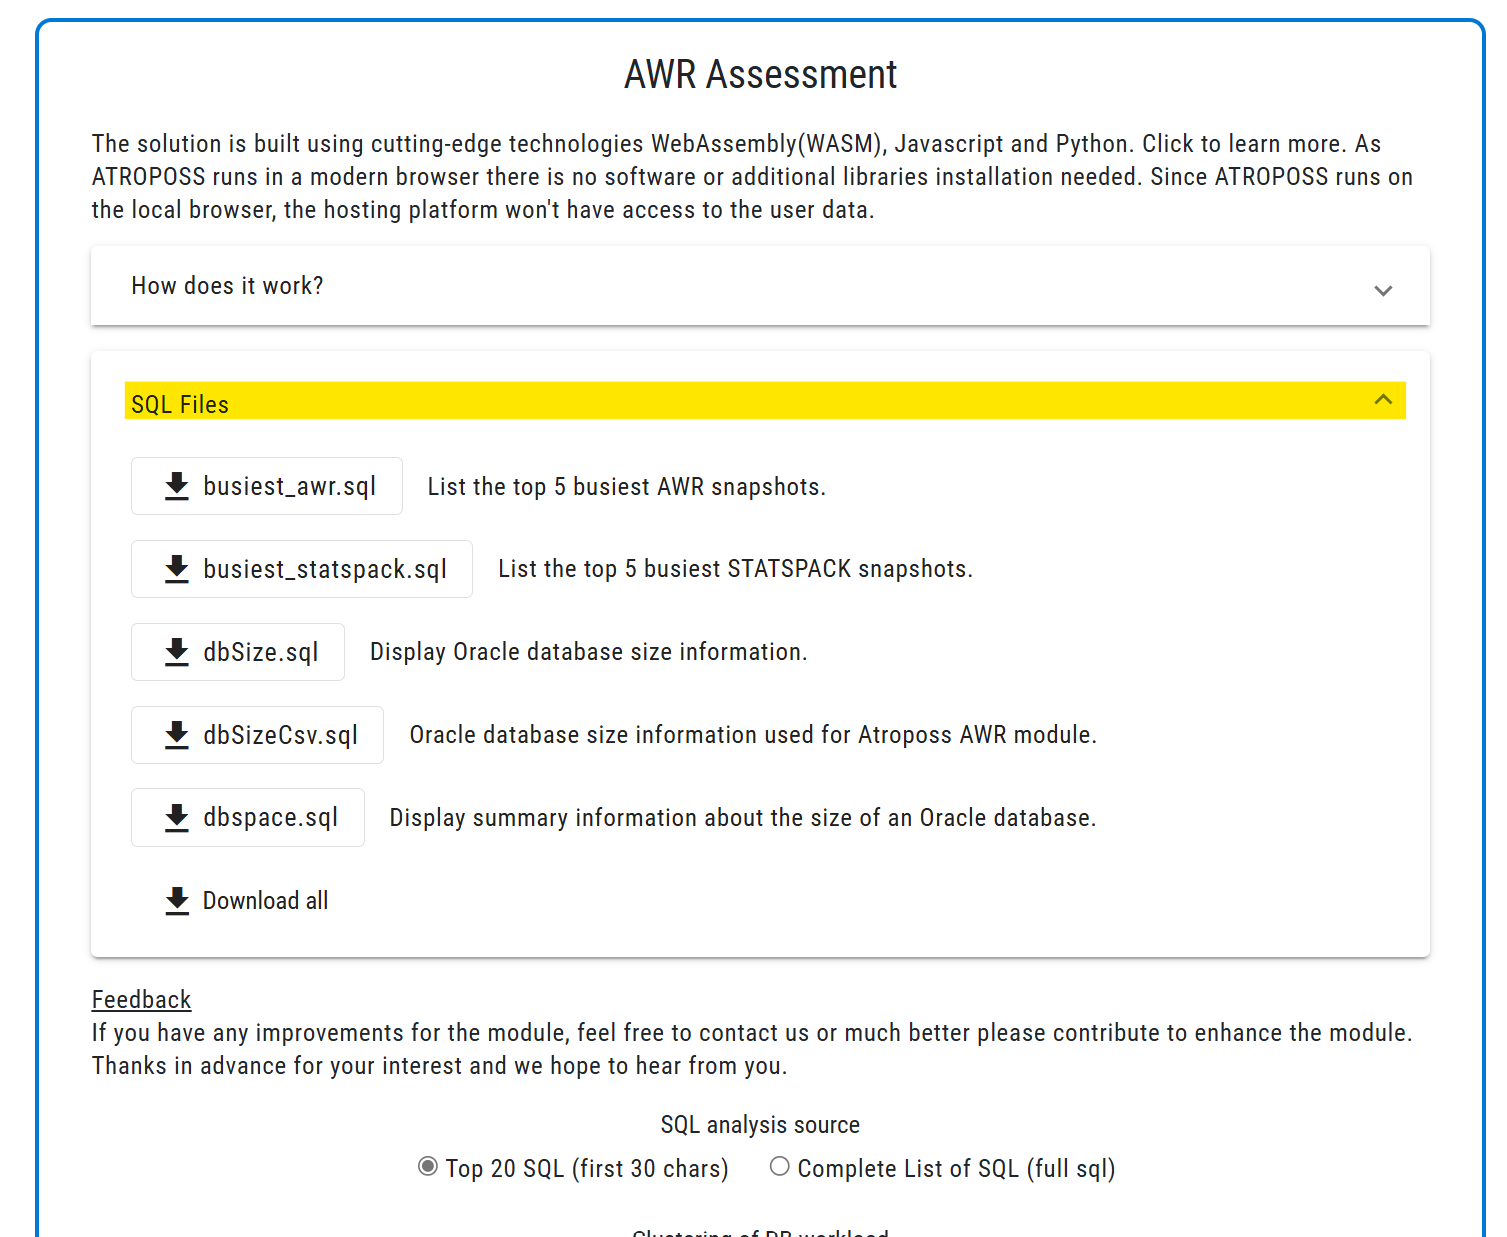
Figure 3: The settings in the module give users the possibility to extend or reduce the parsing inside in AWR’S / statspacks, depending on the requirements. The radio check box “top 20 SQL” will give a minimal insight of used application modules if available, whereas the radio check box “Complete SQL list” will parse over the complete AWR’s / statpacks to list all kind of packages and sql functions.
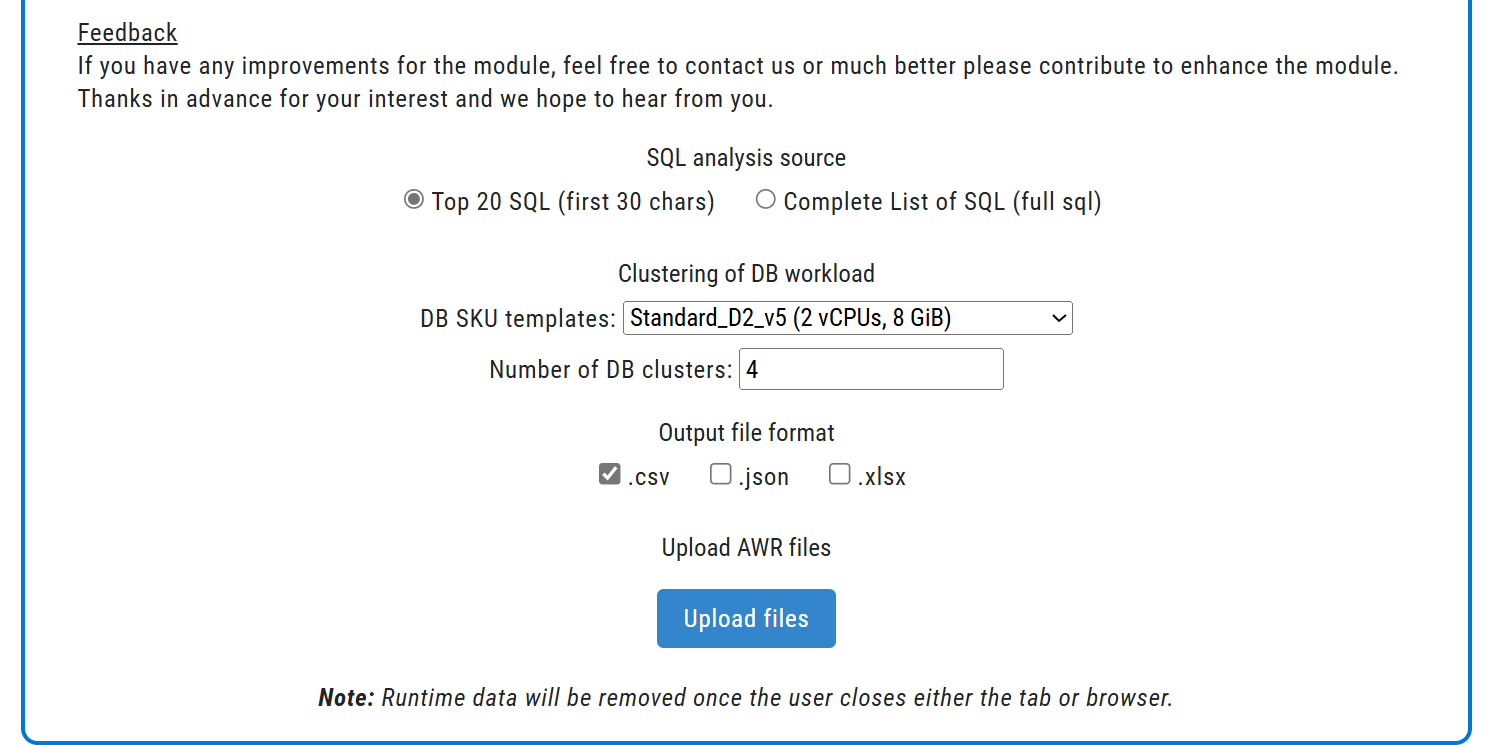
Figure 4: The settings below Cluster of DB workloads is doing a lightweight consolidation of the database based on the chosen “DB sku Template” based on the snap time interval, the calculated consumed CPU and memory behavior during that time period. By uploading multipe reports of different time periods the workload profile over a longer time interval can be calculated as well. The “DB sku Template” represents a small number of available azure sku’s and are limited in this version on D-, E- and M-series. The used D- and E-series are available on IaaS and Postgresql sizing engagements. The setting for the number for DB cluster represent the number of server on which the parsed Oracle databases should be consolidated. The numbering is starting with 0 and is adding +1 if the consolidated databases inside the time series are reaching the limit of the chosen sku resources (Threshold 80%).
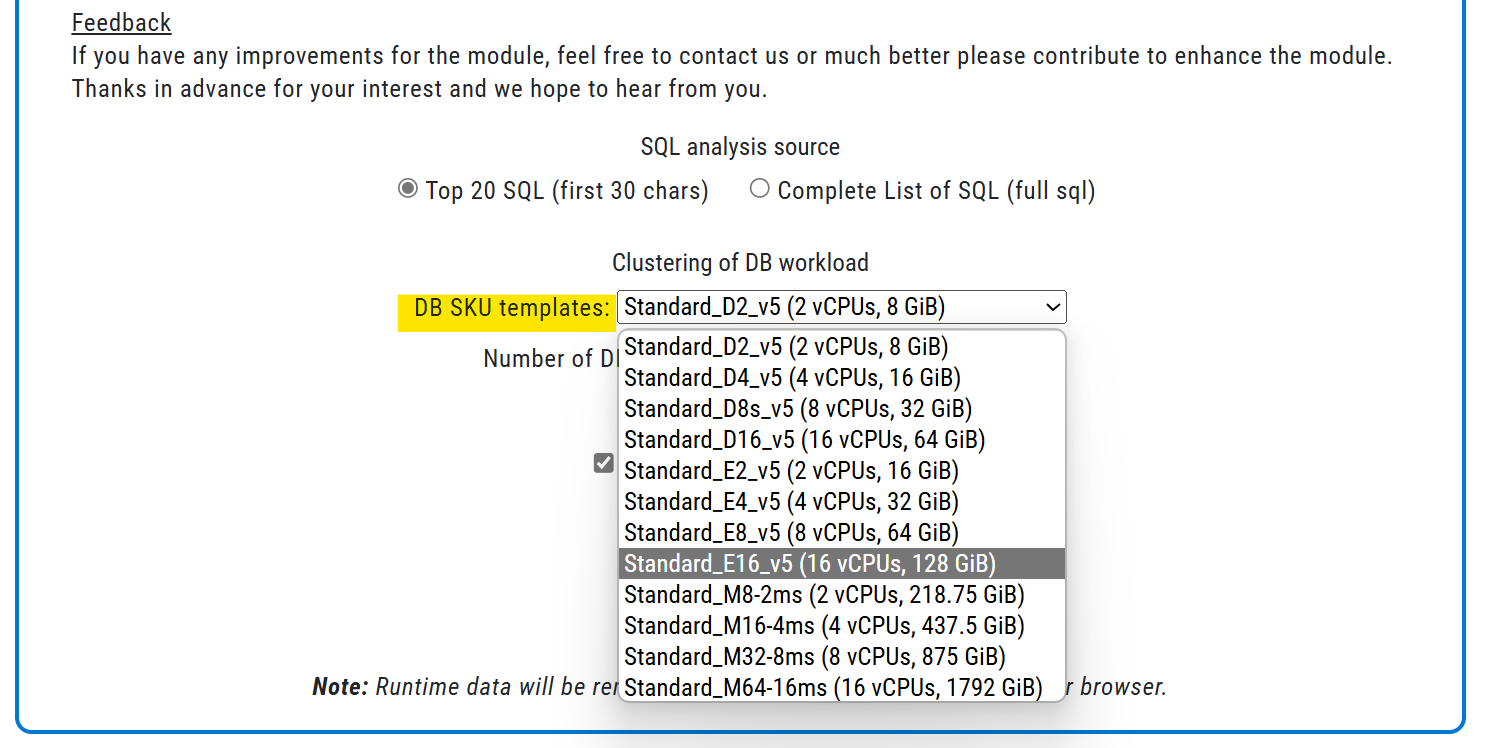
Figure 4a: The Number of DB clusters is an integer you can choose. The number of consoidated server will be calculated based on the required ressources of the chosen sku and not on the chosen number in the UI of the module. If the chosen number was 10 but the databses can be consolidated on 5, the number 5 will be considered! The consolication column in the output format of the parsed databases will be started with cluster 0 (column “cluster consolidation ID”).
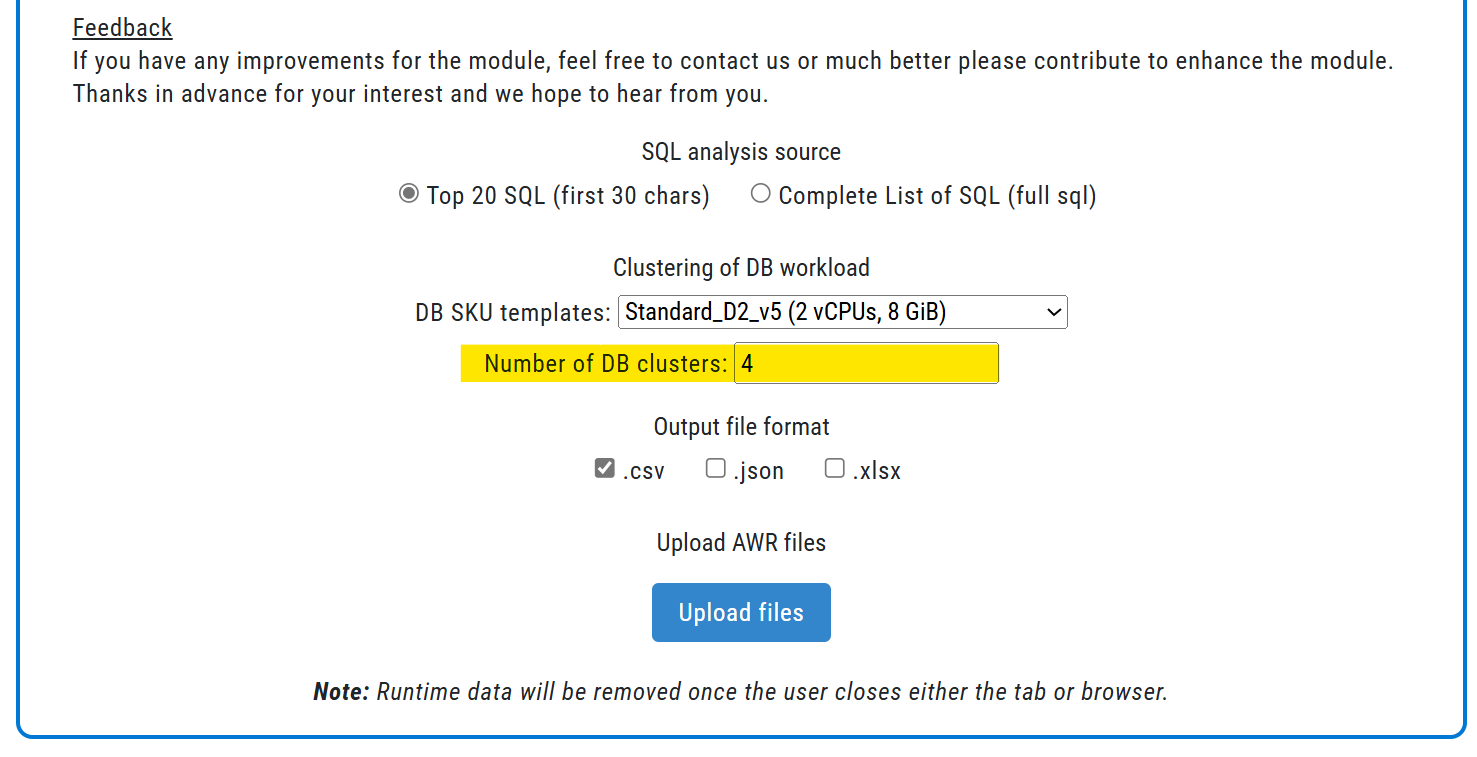
Figure 6: The output format can be chosen between csv, excel or json and depends on the tool of choice for the analysis. Currently we are in developing of a central reporting repository which should be available till end of this CY 2024. In addition we are storing the results in the session browser as well which makes it easy to re-use the output of existing modules as input for others. We will keep you posted, when the reporting module is available.
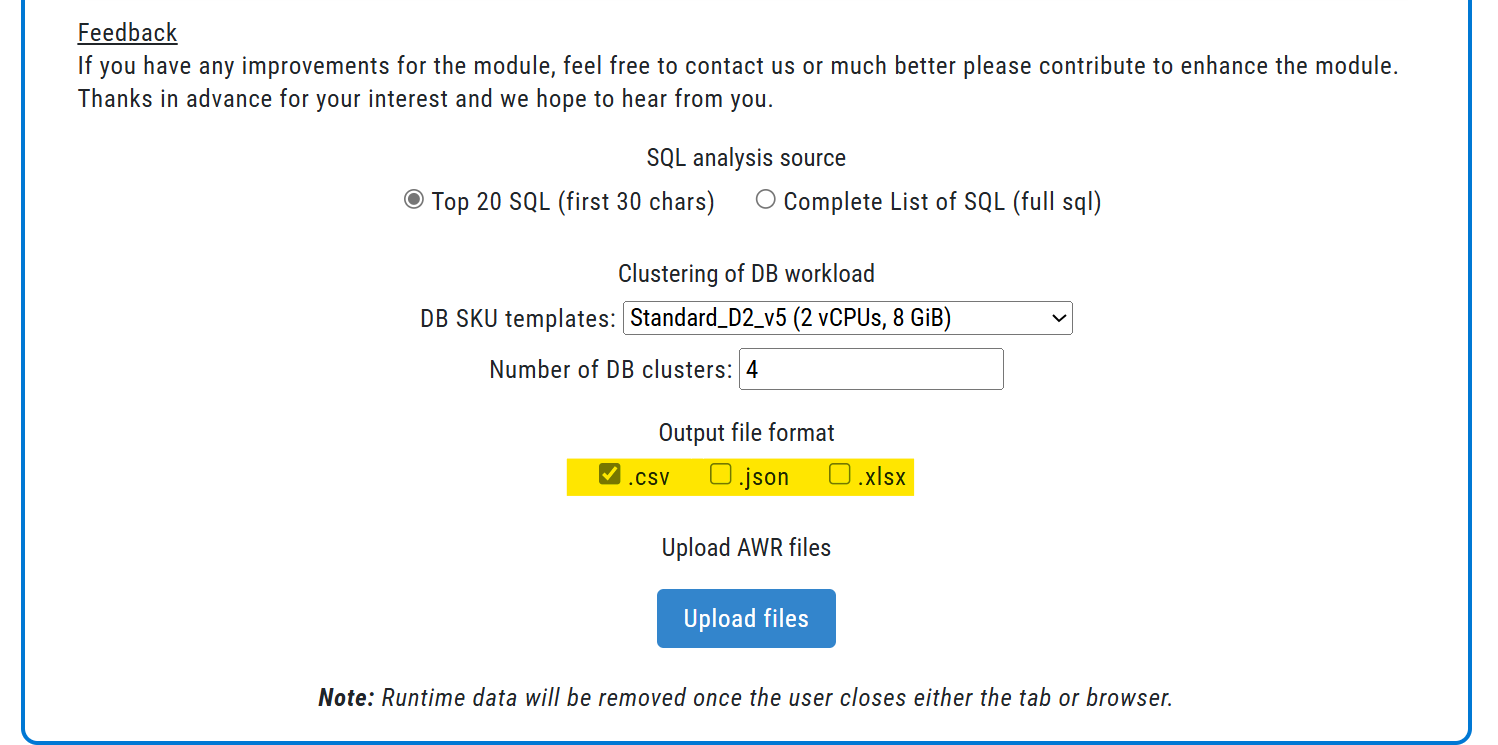
Figure 7: After the Upload Buttion is presses all the different data of the sql scripts, the two RVTool csv’s and multiple AWR’S and Statspack reports can be uploaed at once. Each parses database will be shown as one record in the output formats.
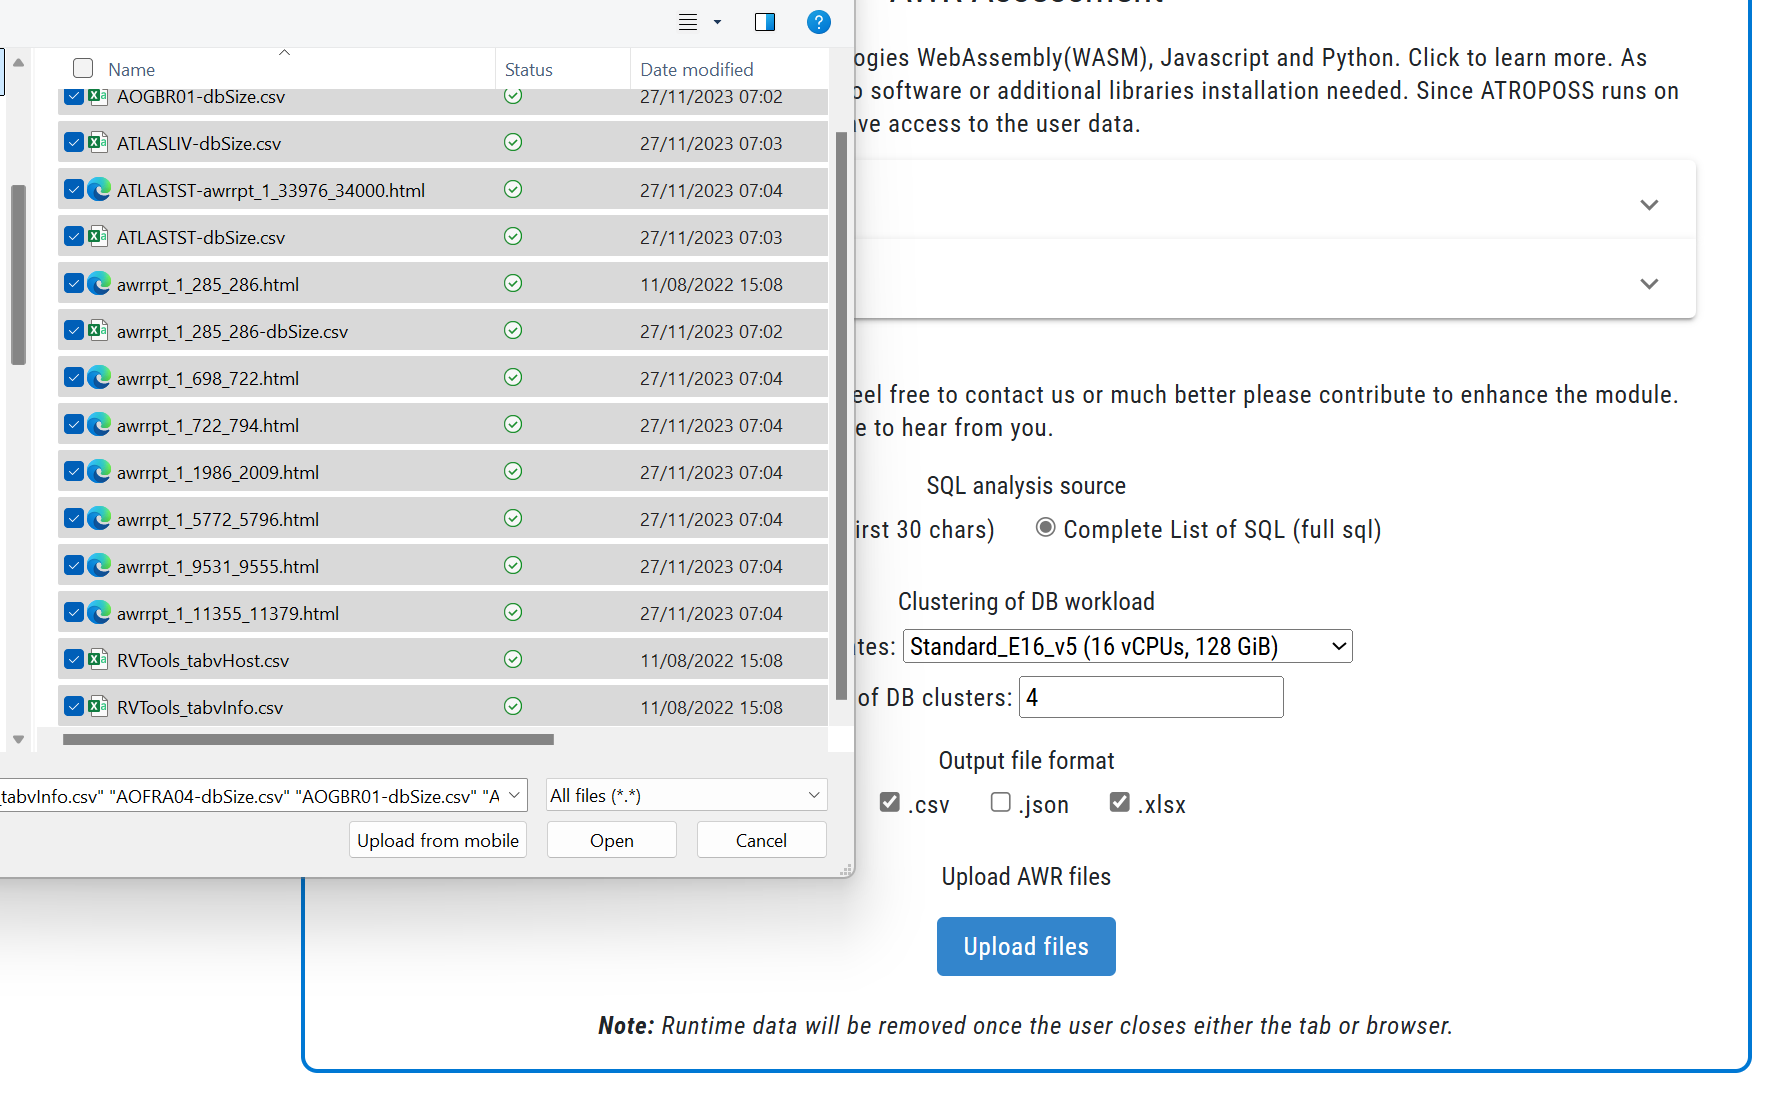
Figure 8 Because the deployment is running in the browser of the users, the performance depends on his underlying hardware. Therfore the overall architecture is scaling with the number of users and doesn’t depend on any backend. The progress bar takes a while till all information are uploaded in the WASM container of the browser and shows in percentage the overall number of parsed information.
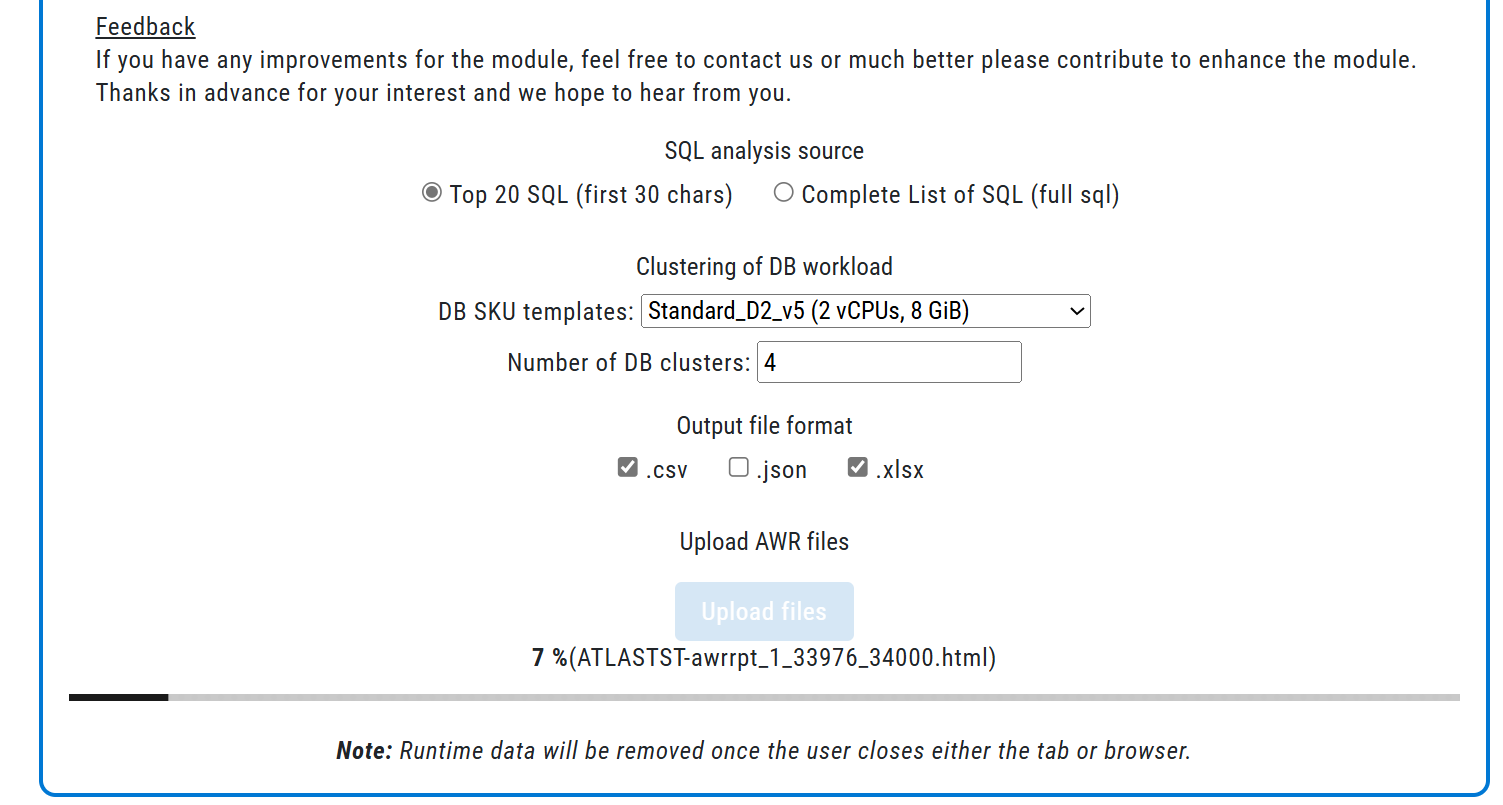
Figure 9: Next to the detailed output formats we have developed a lightweight web report as shown in the following snapshot. The reports has some limited interaction and will be integrated later into the overall reporting for all modules. The “table summary” highlights some limited information and over the available line “Azure VM Comparison” VM’s can be chosen and compared based on prices and performance. Next to Azure VM there is a comparison to AWS and GCP available as well. The VM Comparison is as a standalone solution by our founders and partner available as well - see cloudprice.net.
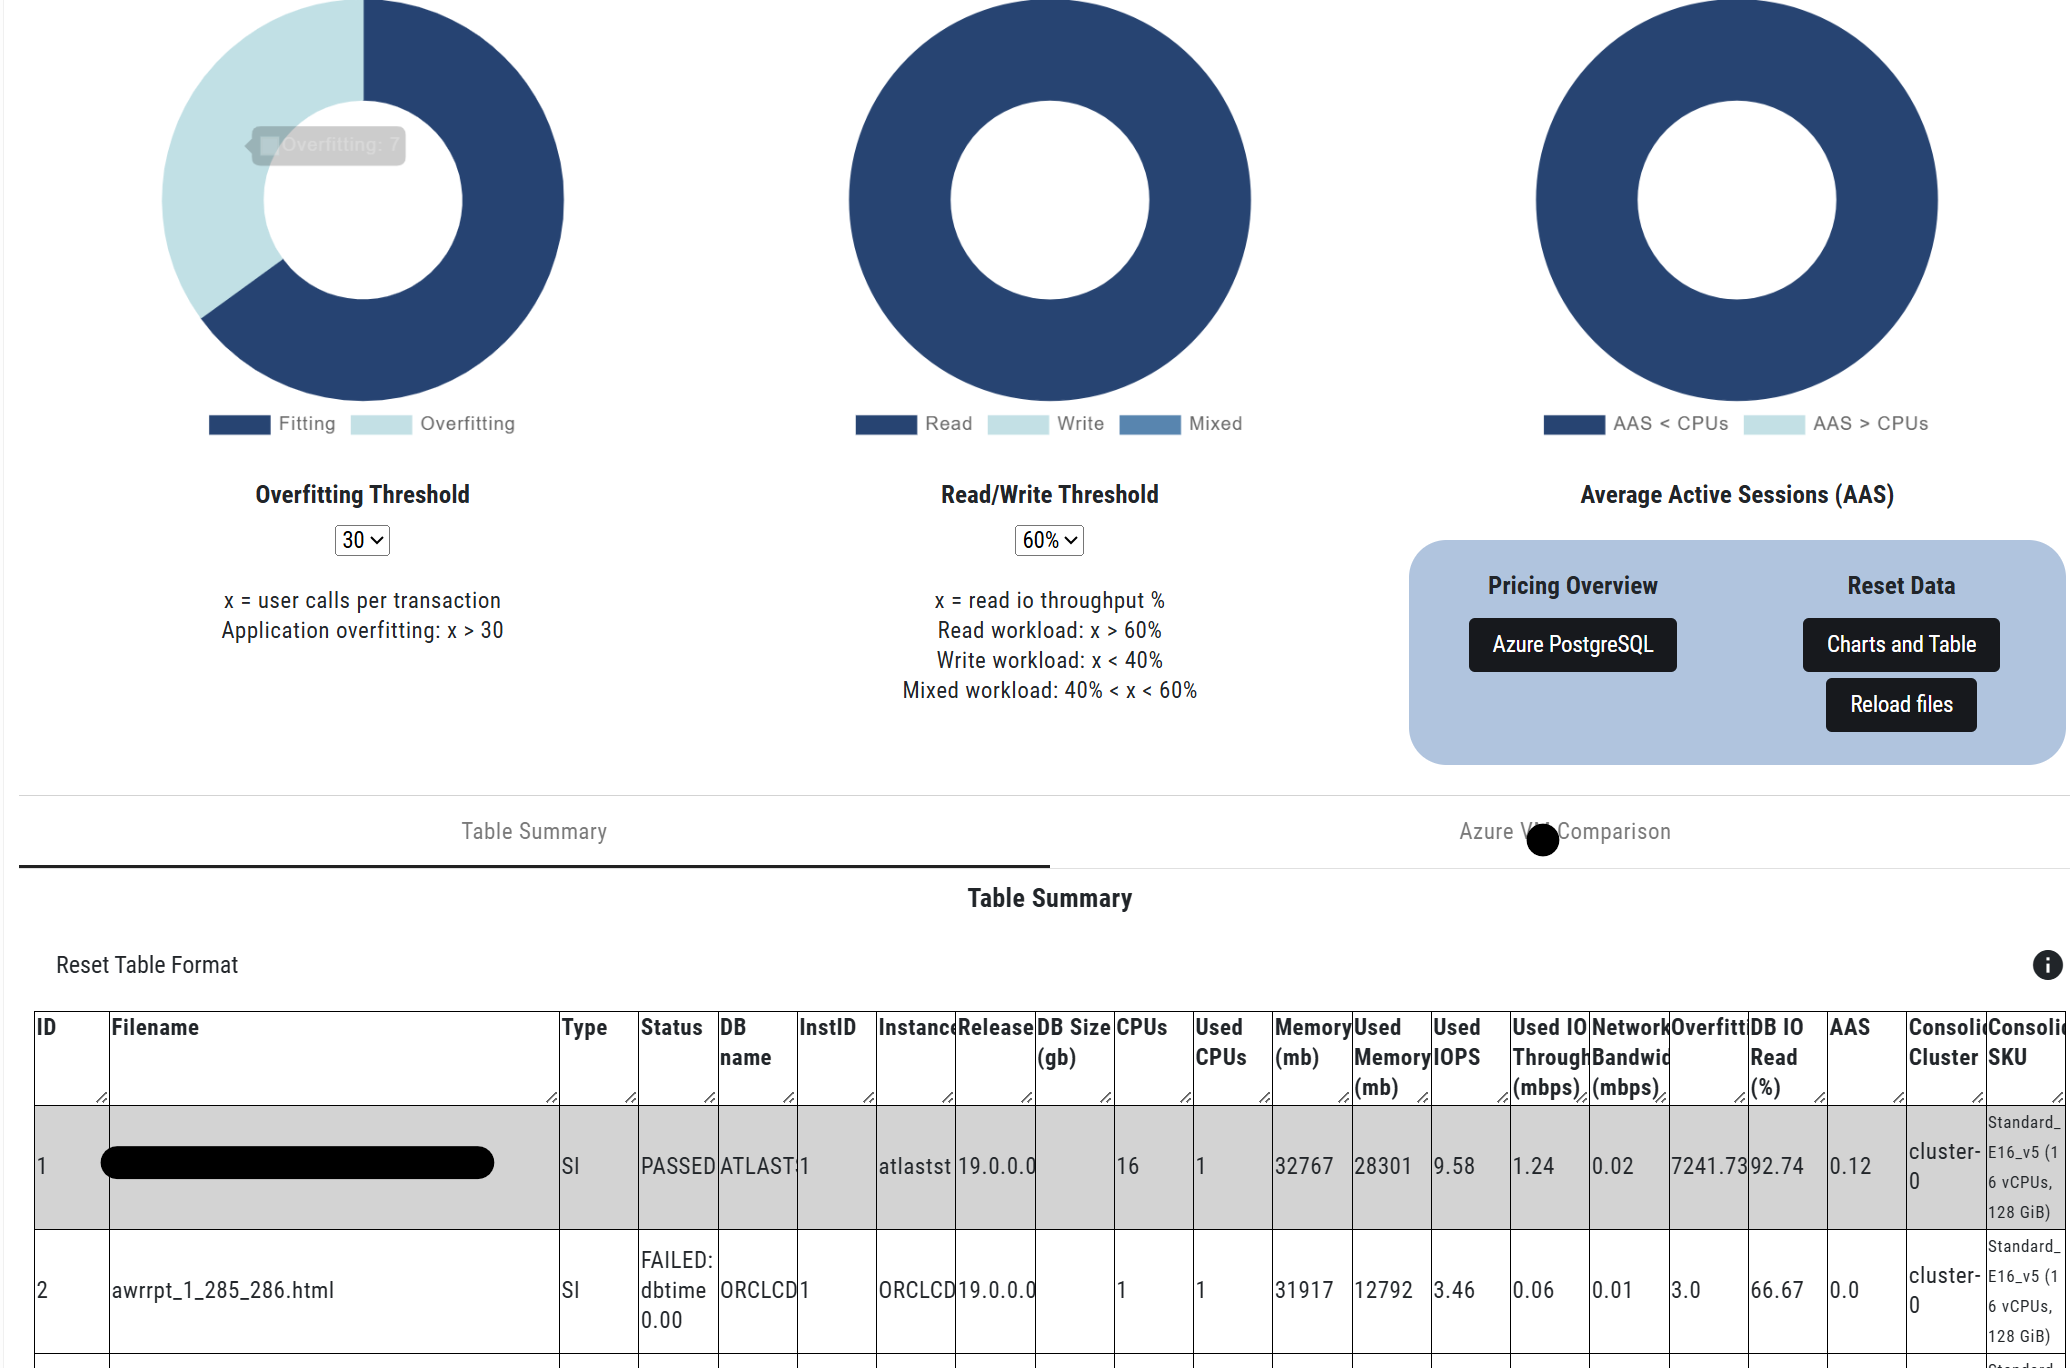
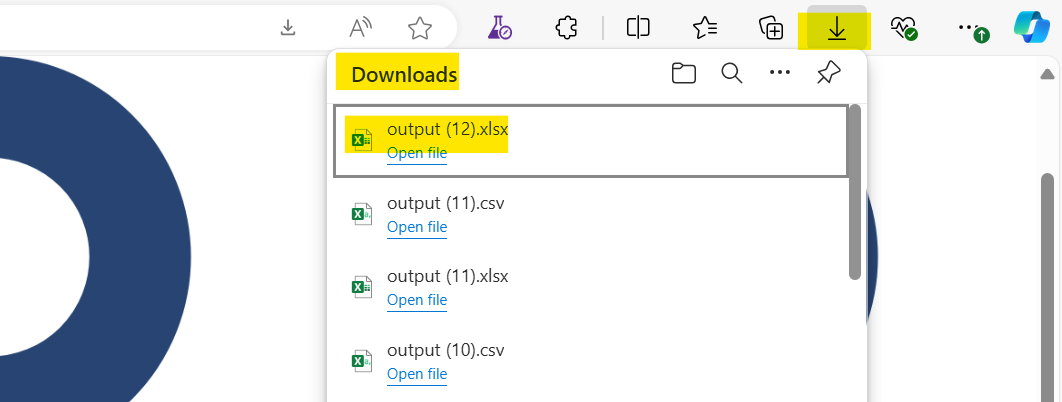
Figure 10: To allow the ATROPOSS the download of the output formats, the users need to give their permission!. The file are available in the download directory of the windows machine.